
Visualizations
GitProjectHealth adds views to the Pharo inspector and provides Roassal visualizations that you can open or export from a script.
Inspector tabs
Section titled “Inspector tabs”Inspect an entity (Ctrl+I) to get these tabs:
| Inspected entity | Tab | Shows |
|---|---|---|
GLHGroup | Group Quality | the projects of the group (and sub-groups), green if their last pipeline succeeded, red if it failed |
group of GLHGroups | Groups Quality | the same, for several groups |
GLHProject | Contributors | the users who committed in the project |
GLHRepository | Commits History | the commit graph (branches and merges) |
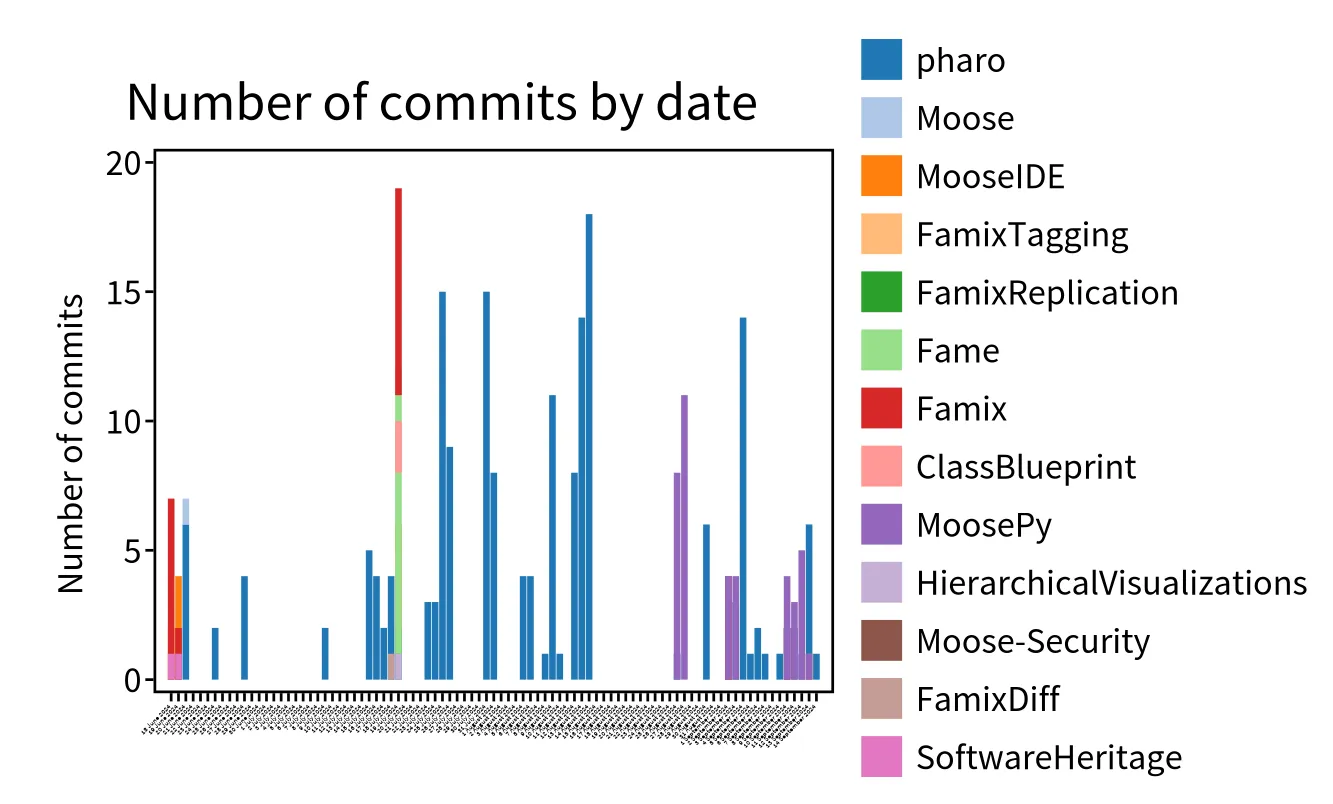
GLHRepository | Commits distribution | number of commits per day, stacked by author |
GLHRepository | Weekly Commits | commits per day of the week |
GLHUser | Commits distribution | commits per day, stacked by project |
GLHUser | Weekly Commits | commits per day of the week |
GLHCommit | Commit View, File Impact, Commits Tree | the diff of the commit, the impacted files, its child commits |
GLHDiff | Diff View, Files Impacted | the diff and the impacted files |
any GLHEntity | Tree | the containment tree of the entity |
Visualizations from a script
Section titled “Visualizations from a script”Each visualization returns a Roassal RSCanvas that you can open, inspect or export.
Group quality
Section titled “Group quality”"group: a GLHGroup imported with a platform importer"canvas := GLHGroupVisualization new forGroup: { group }.canvas open.The colors can be changed with passingPipelineColor:, failingPipelinecolor: and noPipelineColor:.
Commits distribution
Section titled “Commits distribution”commits := (project containedEntitiesOfType: GLHCommit) asOrderedCollection.
"Commits per day, stacked by author (default)"(GLHCommitDistributionVisualization new forCommits: commits) open.
"Commits per day, stacked by project"(GLHCommitDistributionVisualization new groupCommitBlock: [ :commit | commit repository project ]; forCommits: commits) open.
"Commits per day of the week, and average per day of the week"(GLHCommitDistributionByWeekDayVisualization new forCommits: commits) open.(GLHCommitDistributionAverageByWeekDayVisualization new forCommits: commits) open.Contributors of a project
Section titled “Contributors of a project”(GLHProjectContributorVisualization new forProject: project) open.Export
Section titled “Export”SVG or PNG
Section titled “SVG or PNG”canvas := GLHGroupVisualization new forGroup: { group }.
canvas svgExporter withoutFixedShapes; fileName: 'group-health'; export.
canvas pngExporter fileName: 'group-health'; export.Files are written next to the image.
GLHGroupCSVExporter exports, for each project of a group and of its sub-groups, the result and the date of its last pipeline:
csv := GLHGroupCSVExporter new forGroup: group.'group-health.csv' asFileReference writeStreamDo: [ :stream | stream nextPutAll: csv ].