The backend I analyzed follows a common pattern.
In the git repository, there is a folder api containing the microservices, and a folder lib with resources for each microservice.
There is also an additional project called lib-common.
Thus, the microservice home is composed of a project named api-home and a project named lib-home.
Directorysrc
Directoryapi
Directoryapi-home
Directorysrc/
…
Directorylib
Directorylib-home
Directorysrc/
…
Directorylib-common/
…
We wanted to check that dependencies were correctly implemented in the project:
no api project should directly depend on another api (API calls are allowed, but not classic Java dependencies)
each api project can depend on its equivalent lib project
Moose provides ready-to-use visualizations to represent dependencies. In my case, I chose to use the Architectural map.
This visualization presents the entities of the model (packages, classes, methods) as a tree and displays the associations between them (i.e., the dependencies).
I first asked this visualization to display all the classes. It works, but does not allow us to distinguish the different microservices.
The main problem is that too much information is displayed and we cannot see the microservices.
To fix this, I used Moose’s tag feature.
A tag allows you to associate a color and a name to an entity.
So I tagged the classes of my system depending on their location in the repository.
To do this, in a Moose Playground, I used the following script (adapt it to your context 😉):
model allTaggedEntities do: [ :entity| entity removeTags ].
(sa fileName beginsWith: './services/api-A') ifTrue: [ class tagWithName: 'A' ].
(sa fileName beginsWith: './services/api-B') ifTrue: [ class tagWithName: 'B' ].
(sa fileName beginsWith: './services/api-C') ifTrue: [ class tagWithName: 'C' ].
(sa fileName beginsWith: './libraries/lib-A') ifTrue: [ class tagWithName: 'lib-A' ].
(sa fileName beginsWith: './libraries/lib-common') ifTrue: [ class tagWithName: 'lib-common' ].
(sa fileName beginsWith: './libraries/lib-B') ifTrue: [ class tagWithName: 'lib-B' ].
(sa fileName beginsWith: './libraries/lib-C') ifTrue: [ class tagWithName: 'lib-C' ].
]
].
(model allWithSubTypesOf: FamixJavaType) reject: [ :type| type tags isEmpty ]
The result is not perfect yet because entities are not grouped by tag.
To fix this, simply select the tag to add option in the architectural map settings.
You then get a clear visualization of the links between the microservice projects and the libraries they use. We see that no api is linked to an incorrect lib project.
We also notice that microservice B is linked to lib-B as well as lib-common.
Maybe this link to lib-common should be removed? But that’s another story…
Tags can be a powerful tool to visualize things on legacy software and perform analyses.
For example, tags can be used to create virtual entities and see how they “interact” with the real entities of the system analyzed.
In the article Decomposing God Classes at Siemens we show how tags can be used to create virtual classes and see their dependencies to real classes.
In this post I will show another use of tags: how they can materialize a concept and show its instantiation in a system.
The scenario is that of analysing Corese, a platform to “create, manipulate, parse, serialize, query, reason and validate RDF data.”
Corese is an old software that dates back to the early days of Java.
Back then, enums did not exist in Java and a good way to implement them was to use a set of constants:
publicstaticfinalintMONDAY=1;
publicstaticfinalintTUESDAY=2;
publicstaticfinalintWEDNESDAY=3;
publicstaticfinalintTHURSDAY=4;
publicstaticfinalintFRIDAY=5;
publicstaticfinalintSATURDAY=6;
publicstaticfinalintSUNDAY=7;
Those were the days!
As an effort to restructure and rationalize implementation, the developers of Corese wish to replace these sets of constants by real Java enums.
This is not something that can be done in any modern IDE even with the latest refactoring tool.
For an analysis in Moose, we need a model of the system, and this starts with getting the source code (https://github.com/corese-stack/corese-core).
The model is created using VerveineJ which can be run using docker:
docker run -rm -v src/main/java/:/src ghcr.io/evref-bl/verveinej:latest -alllocals -o corese-core.json
This will create a file corese-core.json in the directory src/main/java/.
The command to create the model as an option -alllocals.
This is because VerveineJ by default only tracks the uses of variables with non primitive type (variables containing objects).
Here the constants are integers and if we want to know where they are used, we need more details.
Let’s import the model in Moose.
This can be done simply by dragging-and-dropping the file in Moose.
We will study the use of the constants defined in fr.inria.corese.core.stats.IStats:
publicinterfaceIStats {
publicstaticfinalintNA=0;
publicstaticfinalintSUBJECT=1;
publicstaticfinalintPREDICATE=2;
publicstaticfinalintOBJECT=3;
publicstaticfinalintTRIPLE=4;
[...]
To find where the constants are used, we need to find the representation of the constants in the model.
For this, we can inspect the model (“Inspect” button in the Model Browser) and look for all “Model Attributes”.
The constants are attributes of the interface/class in which they are defined as shown in the listing above).
And they are model attributes because they are defined in the source code analysed, as opposed to System.out which may be used in the code but for which we don’t have the source code.
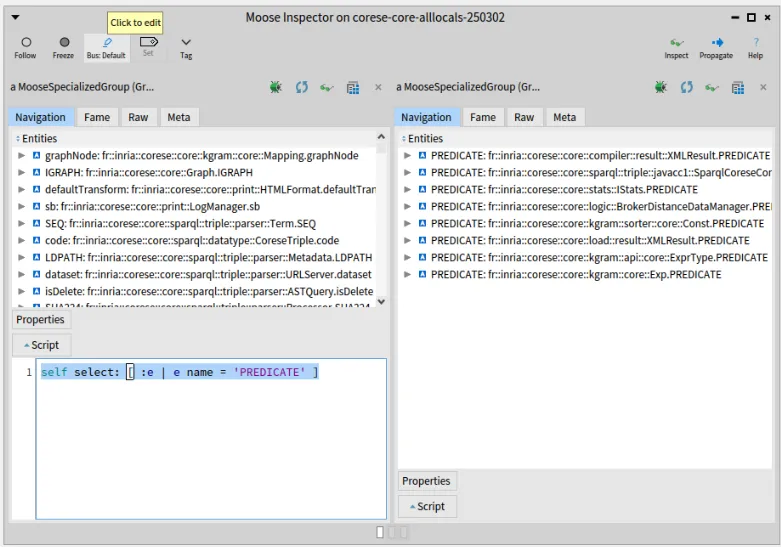
We can then select all the model attributes named PREDICATE:
select: [ :each | each name = 'PREDICATE'].
(note, the backslash (\) before the square bracket ([) was added by the publishing tool and is not part of the code)
Moose gives us 8 different definitions of PREDICATE (and 9 for OBJECT, and 10 for SUBJECT).
The one we are interested in is the 3rd in the list (IStats.PREDICATE).
Having the same constants defined multiple times is not good news for the analysis and for the developers.
But this kind of thing is fairly common in old systems which evolved during a long time in the hands of many developers.
Not all of them had a complete understanding of the system and each had different skills and programming habits.
Looking at the lists of definitions for the 3 main constants (SUBJECT, PREDICATE, OBJECT), we find that there are at least 5 different definitions of these constants:
stats.IStats:
publicstaticfinalintNA=0;
publicstaticfinalintSUBJECT=1;
publicstaticfinalintPREDICATE=2;
publicstaticfinalintOBJECT=3;
publicstaticfinalintTRIPLE=4;
kgram.sorter.core.Const:
publicstaticfinalintALL=0;
publicstaticfinalintSUBJECT=1;
publicstaticfinalintPREDICATE=2;
publicstaticfinalintOBJECT=3;
publicstaticfinalintTRIPLE=4;
publicstaticfinalintNA=-1;
compiler.result.XMLResult
privatestaticfinalintTRIPLE=9;
privatestaticfinalintSUBJECT=10;
privatestaticfinalintPREDICATE=11;
privatestaticfinalintOBJECT=12;
kgram.api.core.ExprType
publicstaticintTRIPLE=88;
publicstaticintSUBJECT=89;
publicstaticintPREDICATE=90;
publicstaticintOBJECT=91;
kgram.core.Exp
publicstaticfinalintANY=-1;
publicstaticfinalintSUBJECT=0;
publicstaticfinalintOBJECT=1;
publicstaticfinalintPREDICATE=2;
So now we need to track the uses of all these constants in the system to understand how they can be replaced by one enum.
Note: Don’t close the Inspector window yet, we are going to need it soon.
Moose can help us here with tags.
Tags are (as the name implies) just labels that can be attached to any entity in the model.
Additionally, tags have a color that will help us distinguish them in visualizations.
So let’s tag our constants.
We will define 5 tags, one for each set of constants, that is to say one for each of the 5 classes that implement these constants.
You can choose whatever name and color you prefer for your tags, as long as you remember which is which.
Here I named the tags from the name of the classes that define each set of constant.
Now we want to tag all the constants in a set with the same tag.
Let’s see how to do it for constants in IStats, the ones listed in the previous section and that were our initial focus.
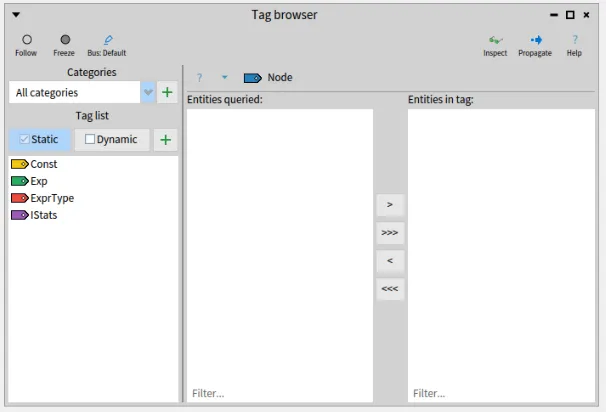
We select the “IStats” tag in the Tag Browser and go back to the Inspector where we have a list of all definitions of PREDICATE.
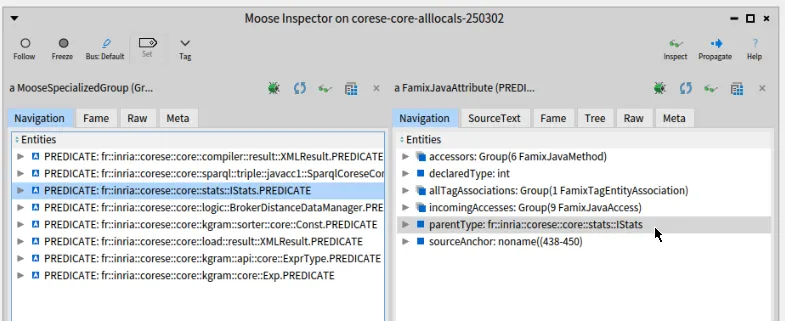
If we click on the 3rd of these PREDICATE (“fr::inria::corese::core::stats::IStats.PREDICATE”), a new pane appears on the right, focusing on this attribute.
There, we can click on its “parentType”, giving yet another pane.
(The following screenshot shows the inspector right before we click on “parentType”).
.
The right pane now focuses on the IStats Java interface.
We can click on “attributes” to get the list of attributes it defines (including PREDICATE from which we started).
There are 5 attributes which are the ones listed in the previous section.
So far so good.
To tag these attributes, we will “propagate” them (toolbar button of the Inspector on the right) to all tools that are in “Follow” mode.
Note that if you minimized the Tag Browser at some point, it will be in “Freeze” mode like in the screenshot above.
You need to put it back in “Follow” (radio toolbar button on the left) before propagating the list of constants.
Once propagated, the list appears in the center pane of the Tag Browser and you can pass it to the right pane with the ”>>>” button.
Doing this will effectively tag the entities with the selected tag.
We now have tagged these 5 constants with the “IStats” tag.
Ideally we want to find also the usage of these constants.
So we would like to also tag the methods that use these constants.
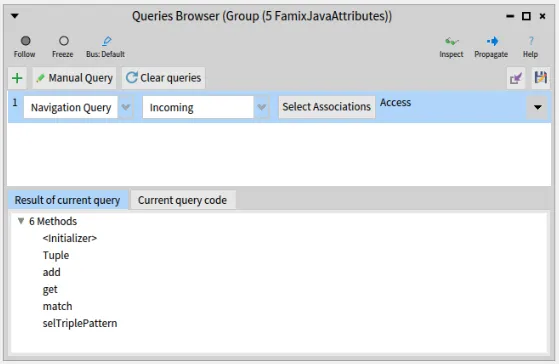
For this you can open a Query Browser, it will start with the same list of 5 attributes that we just propagated.
We can create a “Navigation query” and ask for all the “incoming” “accesses” to these attributes as shown below.
The result is a list of 6 methods.
We can now propagate these 6 methods and they will appear in the Tag Browser.
We tag them with the same tag as the attributes themselves.
You can repeat the same operations for the 5 sets of constants listed above and the 5 different tags.
All this tagging was to be able to visualize where each set of constant is defined and, most importantly, used.
We now turn to the “Architectural Map” which is a fine tool to visualize tags.
for example, we could show all the top level packages of Corese and the Architectural Map will give visual clues on which ones contain tagged entities, and what tags.
The Architectural Map allows to expand the content of entities which will allow us to deep dive into each package containing tagged entities to understand where exactly the entities is used or defined.
To select all the top level packages, we go back one last time to the Inspector to the very first pane on the left (you may also “Inspect” again the model to open a new Inspector).
We select the “Model packages” and enter this query in the “script” at the bottom: self select: [ :each | each parentPackage isNotNil and: [each parentPackage name = 'core'] ].
(Again, ignore the backslashes)
The result is a list of 23 packages that we can propagate.
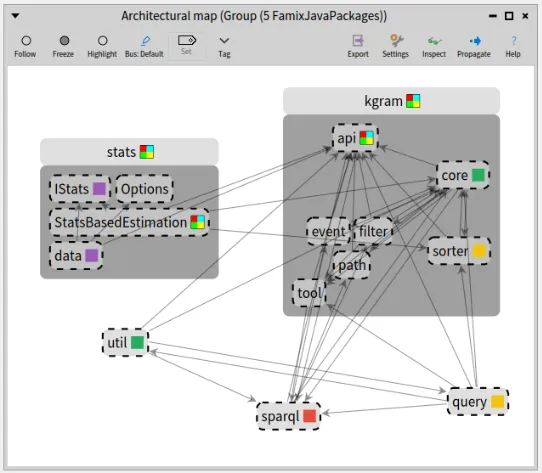
Finally we open an Architectural Map that will start with the 23 packages that we just propagated.
In the following screenchot, I restricted the Architectural Map to the only 5 packages that do use our tags: “stats”, “kgram”, “util”, “sparql”, and “query”.
This makes it easier to see the results here.
I also expanded “kgram” that is small and contains different tags.
The single-color square, on the right of each package name, shows that it contains entities having one uniq tag (of this color).
In our case it means that it contains the constants and methods accessing them, all with the same tag.
For example, “core” and “util” packages contain entities tagged with only the green tag (which corresponds to the kgram.core.Exp class as previously shown in the Tag Browser screenshot).
When the square is multicolored, it means it contains entities with different tags.
For example, we see that the package “kgram” contains at least the green (“Exp”) and the yellow (“Const”) tags.
Note that in this particular case, I added another tag for class kgram.api.core.Node which has its own definition of the OBJECT constant.
I wanted to see where it was used also.
This is the reason for the multicolored square of class StatsBasedEstimation, in package “stats”, which uses OBJECT from Node and the other constants from IStats.
In the end, the visualization allows to conclude that each package sticks pretty much to its own definition of the constants which is rather reassuring.
It also shows where one would have to look if we were to replace the constant by a real enum.
This is not the end of it however because the constant values used in these methods can be passed off to other methods as argument.
Here Famix alone (the meta-model used in Moose by default) can no longer help us to follow the flow of usage of the constants because they are just integer being passed around.
For a finer analysis, a complete AST model should be used.
This could be done with the FAST meta-model (Famix-AST), but it is another story that falls outside the scope of this blog-post.
During my Ph.D. migration project, I considered the migration of several GUI aspects:
visual
behavioral
business
These elements are the main ones.
When perfectly considered, you can migrate the front-end of any application.
But, we are missing some other stuff 😄
For example, how do you migrate i18N files?
In this post, I’ll present how to build a simple migration tool to migrate I18N files from .properties (used by Java) to .json format (used by Angular).
As a source, I have several .properties files, including I18N for a Java project.
Each file has a set of key/value and comments.
For example, the EditerMessages_fr.properties is as follow:
##########
# Page : Edit
##########
pageTitle=Editer
classerDemande=Demande
classerDiffusion=Diffusion
classerPar=Classer Par
And it’s Arabic version EditerMessages_ar.properties
#########
# Page : Editer
#########
pageTitle=تحرير
classerDemande=طلب
classerDiffusion=بث
classerPar=تصنيف حسب
As a target, I need only one JSON file per language.
Thus, the file for the french translation looks like this:
{
"EditerMessages" : {
"classerDemande" : "Demande",
"classerDiffusion" : "Diffusion",
"classerPar" : "Classer Par",
"pageTitle" : "Editer"
}
}
And the Arabic version:
{
"EditerMessages" : {
"classerDemande" : "طلب",
"classerDiffusion" : "بث",
"classerPar" : "تصنيف حسب",
"pageTitle" : "تحرير"
},
}
To perform the transformation from the .properties file to json, we will use MDE.
The approach is divided into three main steps:
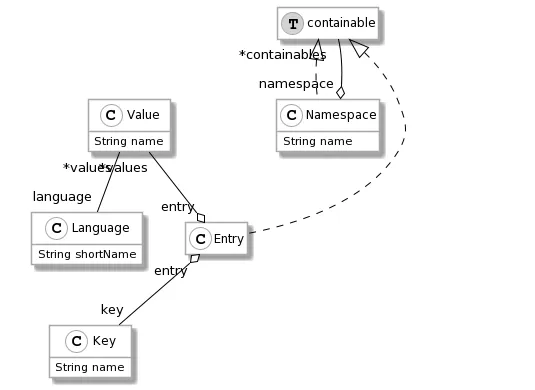
Designing a meta-model representing internationalization
I18N files are simple.
They consist of a set of key/values.
Each value is associated with a language.
And each file can be associated with a namespace.
For example, in the introduction example, the namespace of all entries is “EditerMessages”.
I designed a meta-model to represent all those concepts:
Once the meta-model is designed, we must create an importer that takes .properties files as input and produces a model.
To produce a model, I first look for a .properties parser without much success.
Thus, I decided to create my own parser.
Given a correctly formatted file, the parser provides me the I18N entries.
Then, by iterating on this collection, I build an I18N model.
Now that we can parse one file, we can build a I18N model.
To do so, we will first parse every .properties file.
For each file, we extract the language and the namespace based on the file name.
Thus, EditerMessages_fr.properties is the file for the fr language and the EditerMessages namespace.
Then, for each file entry, we instantiate an entry in our model inside the namespace and with the correct language attached.
importString: aString
(parser parse: aString) do: [ :keyValue|
(self model allWithType: CS18NEntry) asOrderedCollection
detect: [ :entry|
"search for existing key in the file"
entry key name = keyValue key ]
ifOne: [ :entry|
"If an entry already exists (in another language for instance)"
entry addValue: ((self createInModel: CS18NValue)
name: keyValue value;
language: currentLanguage;
yourself) ]
ifNone: [
"If no entry exist"
(self createInModel: CS18NEntry)
namespace: currentNamespace;
key: ((self createInModel: CS18NKey)
name: keyValue key;
yourself);
addValue: ((self createInModel: CS18NValue)
name: keyValue value;
language: currentLanguage;
yourself);
yourself ] ]
After performing the import, we get a model with, for each namespace, several entries.
Each entry has a key and several values.
Each value is attached to the language.
Once my importer and exporter are designed, I can perform the migration.
To do so, I use a little script.
It creates a model of I18N, imports several .properties file entries in the model, and exports the Arabic entries in a JSON file.
TypeScript is a more and more popular programming language, and so it would be great if we could analyze TypeScript projects using Moose.
At the time of writing, no meta-model (or importer) exists for the TypeScript language in Moose.
First, what are the pieces of the puzzle needed to analyze TypeScript with Moose?
Before we consider TypeScript, let’s look at how things work with Java:
VerveineJ is the importer that can generate models of Java files, allowing us to do analyses in Pharo/Moose.
If we want to do the same thing for TypeScript, we would need:
an equivalent of VerveineJ (importer) for TypeScript files,
a Famix model of TypeScript.
Creating a parser and importer for TypeScript is no small task, but TypeScript is a popular environment and we can use ts-morph to facilitate the navigation of the TypeScript AST.
There’s also a very cool visualization of TypeScript ASTs, which will be useful for understanding and debugging.
Designing a new meta-model for TypeScript is definitely not trivial, because it requires a deep understanding of the language.
On the other hand, once a meta-model exists, it’s easy to generate using FamixNG domain-specific language.
Pragmatically speaking, do we need a perfect model of TypeScript to analyze it?
By searching the web for TypeScript and Moose, I discovered a GitHub project called pascalerni/abap2famix.
It is an ABAP importer (written in TypeScript) that models ABAP projects using FAMIX 3.0 (compatibility meta-model for Java).
Java and ABAP are indeed different languages, but perhaps the differences are not so important if we want to do some static analysis?
Seems like a pragmatic approach!
Looking at the node packages used by abap2famix I discovered famix, a TypeScript implementation of Famix, which facilitates creating FAMIX 3.0 entities from TypeScript.
Its source is at pascalerni/famix, and I could see that much of it was generated, e.g., in class.ts there’s proof it was not written by hand:
// automatically generated code, please do not change
How was this code generated? The answer is the fork of FameJava at pascalerni/FameJava, namely the Famix30Codegen.java file.
The original FameJava was used to generate the Java API for use with FAMIX 3.0 metamodel.
This fork generates (via Java) a TypeScript API.
Clever and useful!
So, what if we try to create an importer using ts-morph and the famix packages that will model TypeScript programs in a Java metamodel?
As a first try, model only the object-oriented elements of TypeScript, such as classes, methods, attributes, etc.
Several teams set out to achieve this goal, although none of the students had ever done parsing or Pharo before.
Many were familiar with node and TypeScript.
I’m happy to say that they all were successful (in varying degrees) in writing an importer for TypeScript that allowed analyses to be done in Moose and Pharo, and their results are all on GitHub:
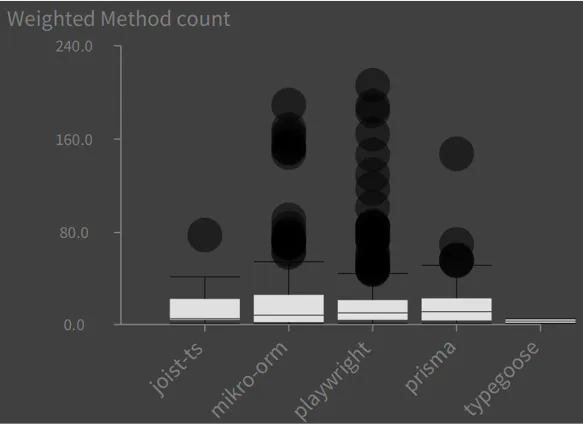
Here are some visualizations produced by Team 4 using Roassal on models loaded into Moose.
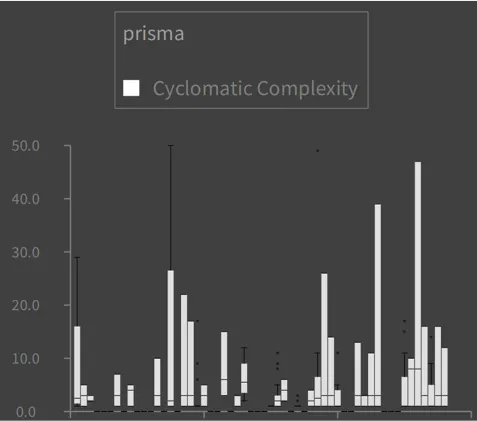
The first shows the Weighted Method Count (sum) for classes in several TypeScript projects. The cyclomatic complexity values were calculated using another npm package (ts-complex) in the TypeScript importer:
The following chart shows distributions of Cyclomatic Complexities of methods for various classes in the prisma project:
Here are some of the obvious things in TypeScript (Javascript) that don’t quite fit into a Java model:
Functions can exist in the global namespace. A workaround proposed by one team was to create a “Global” class in the Java model, and just put functions there as static methods.
Functions can exist in methods, but maybe this is possible to model in a newer meta-model for Java that supports lambdas. The API from pascalerni/famix supports an older meta-model for Java.
string, number, any are types in TypeScript, but they do not really map to primitive types or classes in Java.
TypeScript doesn’t have packages like Java, although it does have ways to specify namespaces and avoid naming conflicts.
Even though a formal model in TypeScript doesn’t (yet) exist in Famix, it’s possible to perform useful analyses of TypeScript using the FAMIX 3.0 (Java) metamodel, thanks to packages, tools and APIs developed and reused in the npm and Moose communities.
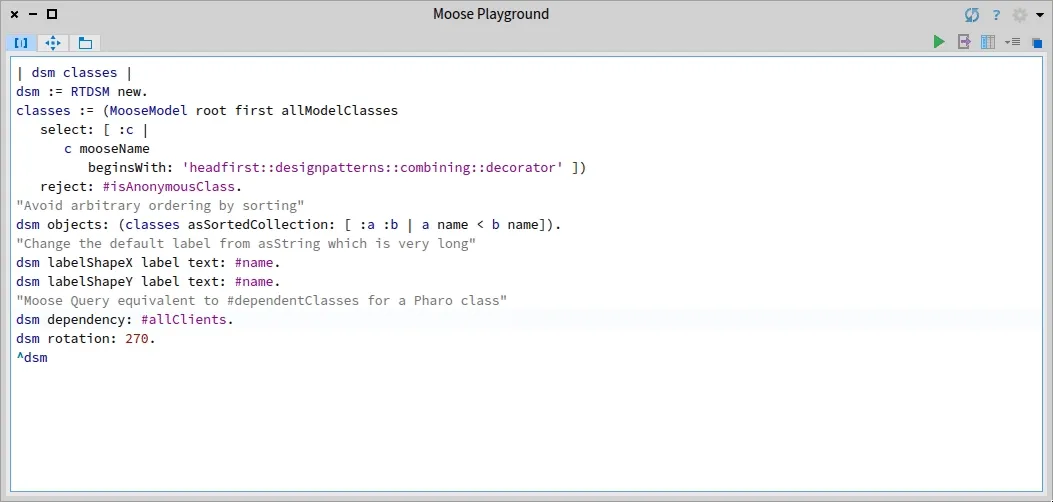
As an extension to Analyzing Java With Moose, in this post I will show how one can create a Design Structure Matrix (DSM) in Moose, in particular from a model of a Java project.
Roassal (which is a visualization platform that’s part of Moose) has a visualization for DSM called RTDSM.
It’s explained here, but with Pharo classes.
How to use it with Moose on a Java model?
The key is in the dependency: block, which we define using a Moose Query with allClients.
Open a Moose Playground and paste the following Pharo code:
How is our API used? This is the question the Pharo debugging team came to me with. They needed to know if it is used as they intended to or if there are some improvements to do.
To answer that question, we used some of Moose new browsers.
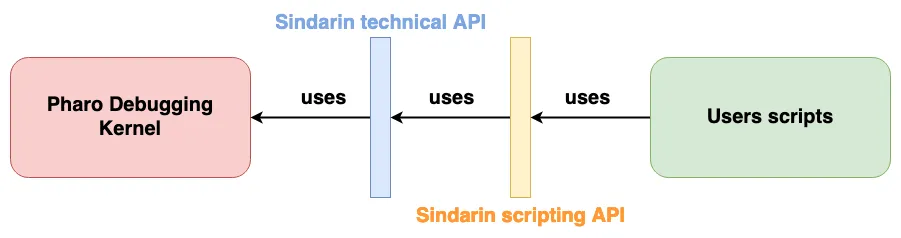
The Pharo debugging team works on Sindarin, an API that eases the expression and automation of debugging tasks.
Sindarin is made of two layers:
The “technical” API is the minimal API needed to interact with a debugging kernel (the Pharo kernel here).
The “scripting” API is here to ease the writing of debugging scripts without having to manipulate low-level concepts.
Now, that’s the theory.
In reality, the debugging team realized that these two layers are not really respected: users bypass the scripting API to use technical methods and the debugging kernel methods directly.
We used Moose to analyze Sindarin API usage, to help understand if, and how, it should be improved.
Moose has recently been upgraded and now offers more modularity.
Users can analyze their model through new specialized browsers that allow users to navigate and visualize their model entities.
Entities are propagated from one browser to the others, dynamically updating their contents.
Helping the debugging team was an opportunity to test some of these browsers under operating conditions.
Analysis of the interactions of the users scripts with Sindarin and with the debugging kernel
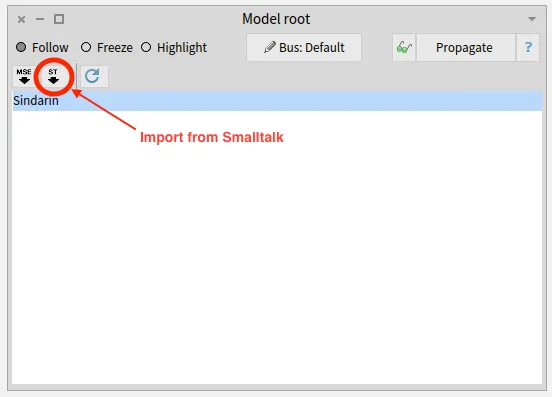
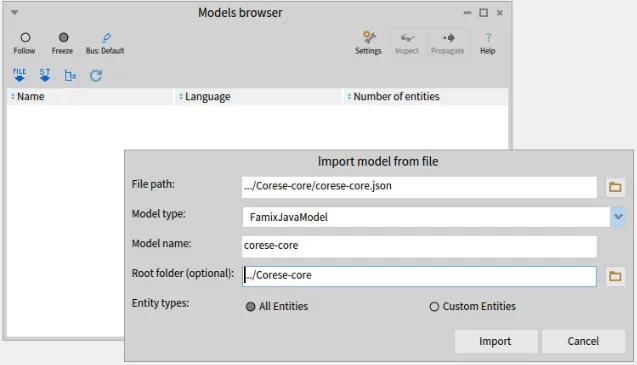
We imported the model directly from Pharo, using the Model Root browser.
This browser is the entry point to modular Moose.
It shows the list of installed models and allows to import new ones from MSE files or from Pharo.
Once the model was imported, it was automatically propagated in modular Moose, to other browsers.
Querying the model to select key elements from the model
The purpose of this browser is to query a model or a group of entities.
It can filter entities according to their type or the value of their properties.
It can also use MooseQuery to navigate associations (inheritances, invocations, accesses, and references) and scopes (containment).
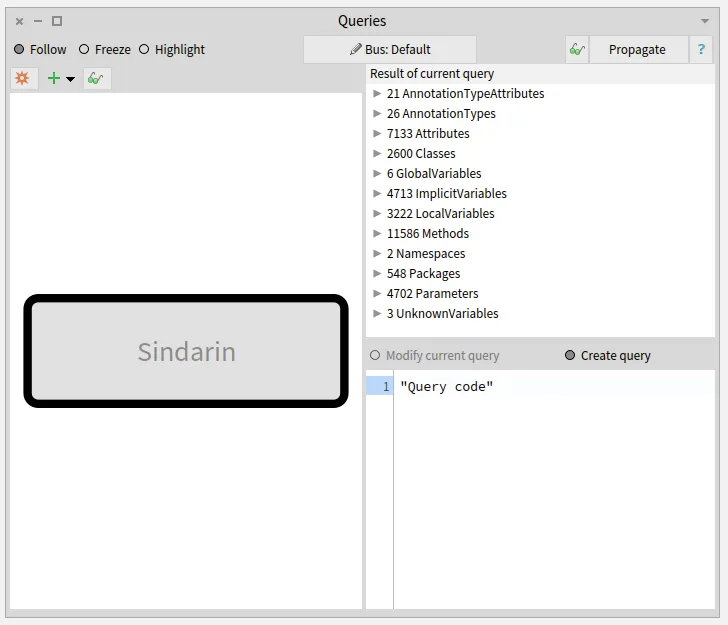
The left pane of the browser is a visualization of the queries that were made.
On the image above, no queries were made yet. The left pane only shows the model on which queries will apply.
The right pane of the browser shows the result of the selected query and the code used to build it.
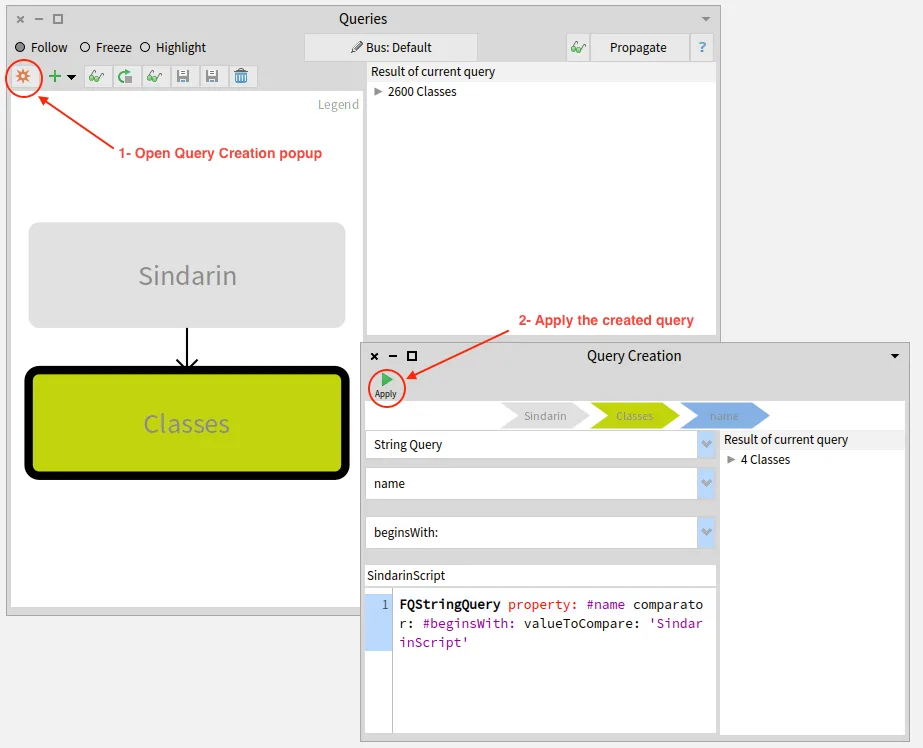
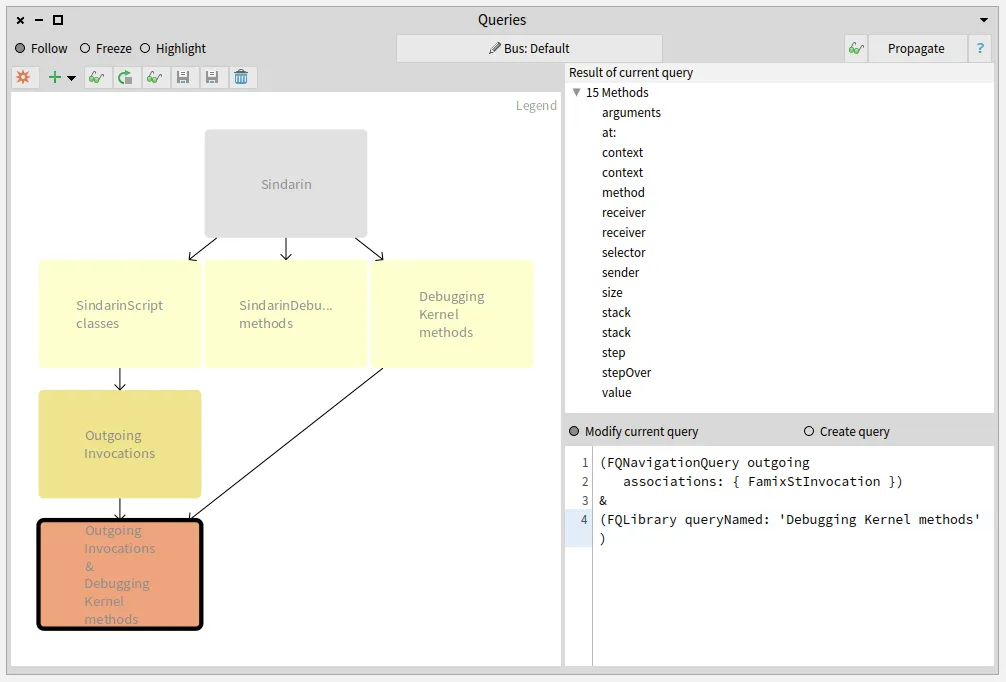
We added a navigation query to obtain methods that were called in the script. We then narrowed this result by selecting methods from Sindarin or from the debugging kernel.
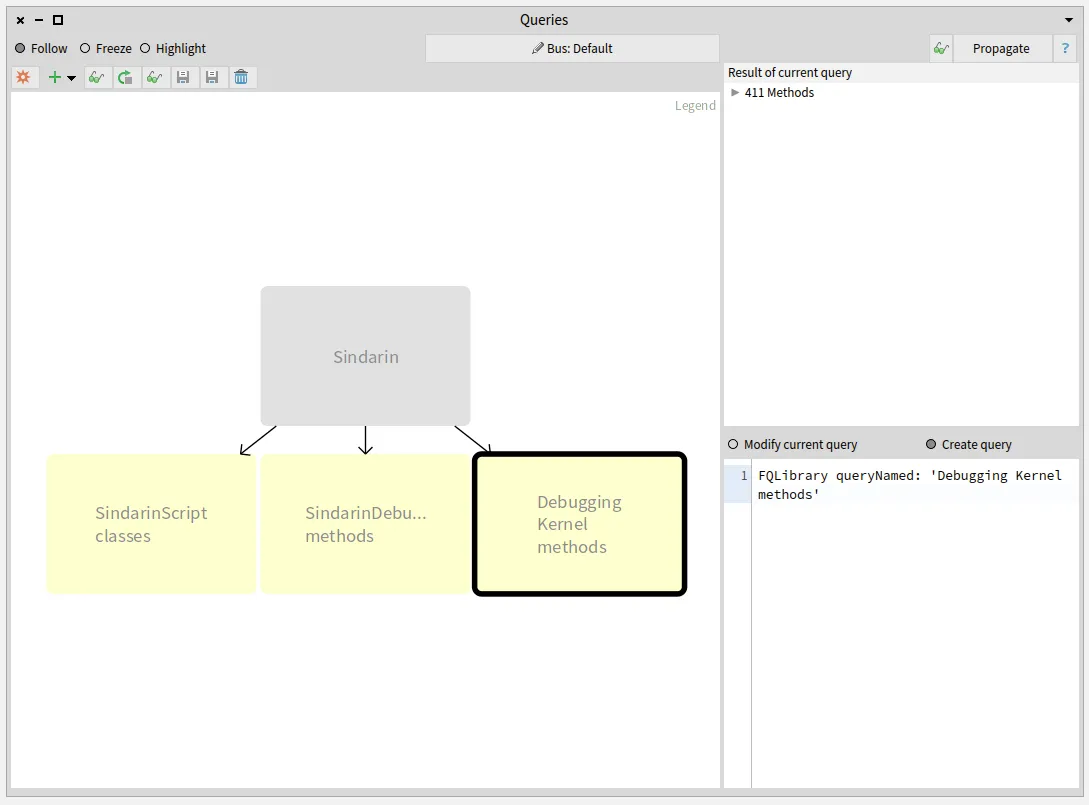
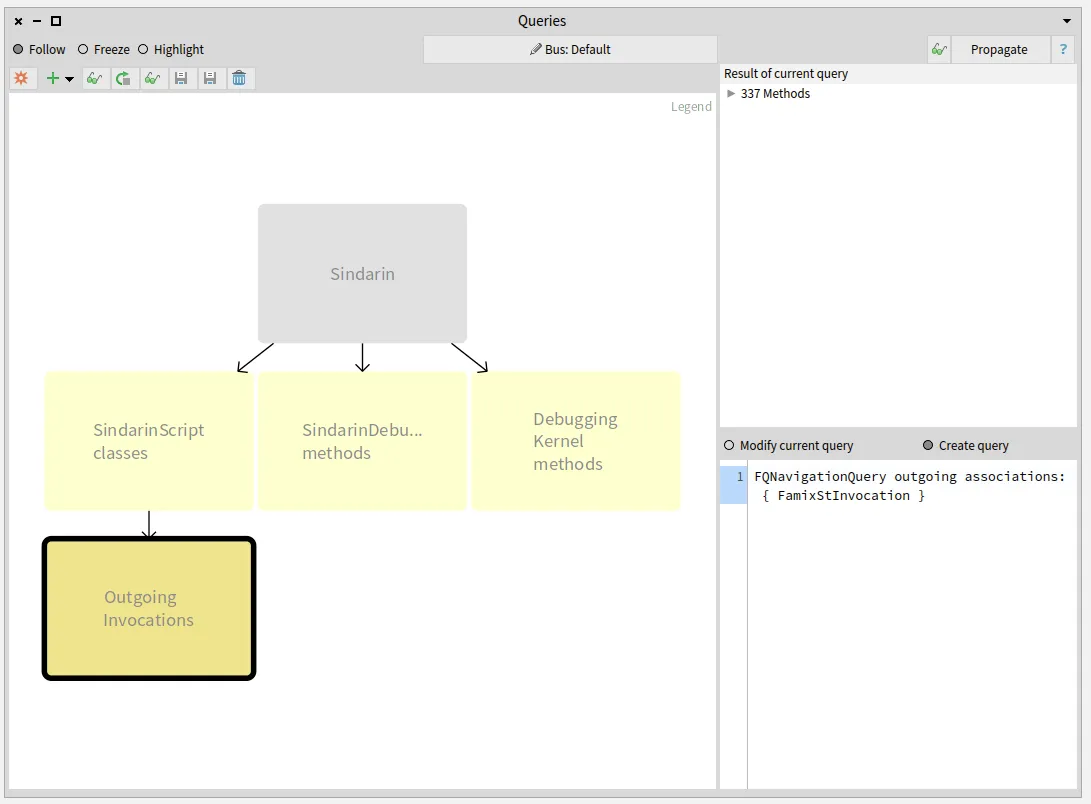
To find which methods are called in the users scripts, we queried outgoing invocations from the scripts classes.
We obtained a group of 331 candidate methods whose signatures match messages sent in the scripts:
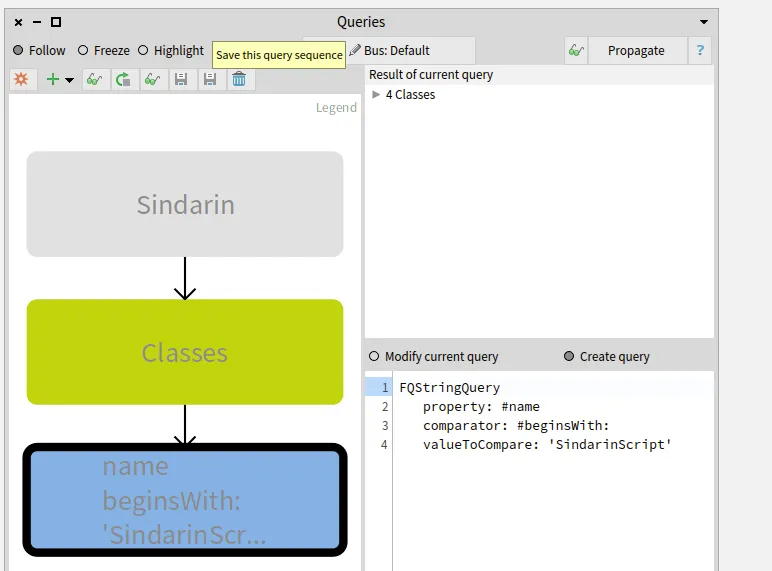
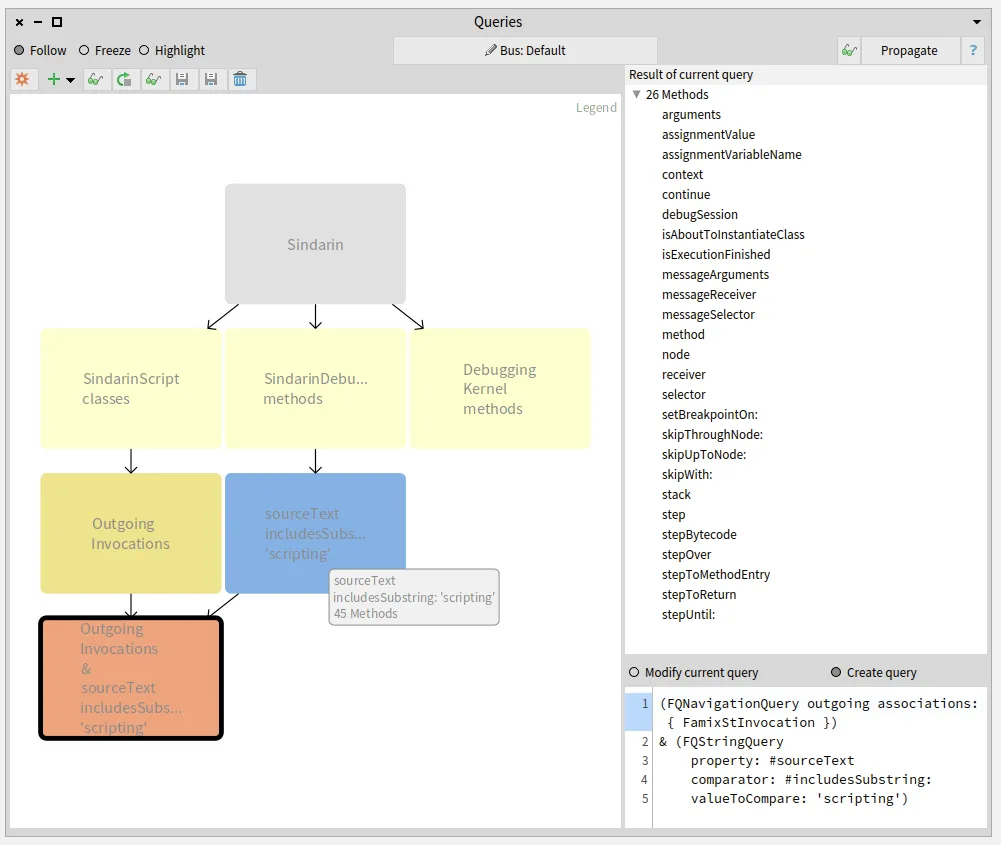
The next step was to compare this group of candidates with the methods from Sindarin scripting API.
We established with the debugging team that scripting methods should have "scripting" as comment.
This convention allowed us to get them with a property query (blue query in the figure below).
We queried for the intersection between the scripting API and the group of candidates invoked from the users scripts (salmon query at the bottom left in the figure below).
This gave us 26 methods that are called from the scripts, out of 45 in the Sindarin scripting API:
These 26 mehtods, result of the last query performed, are listed in the top right pane of the Query browser.
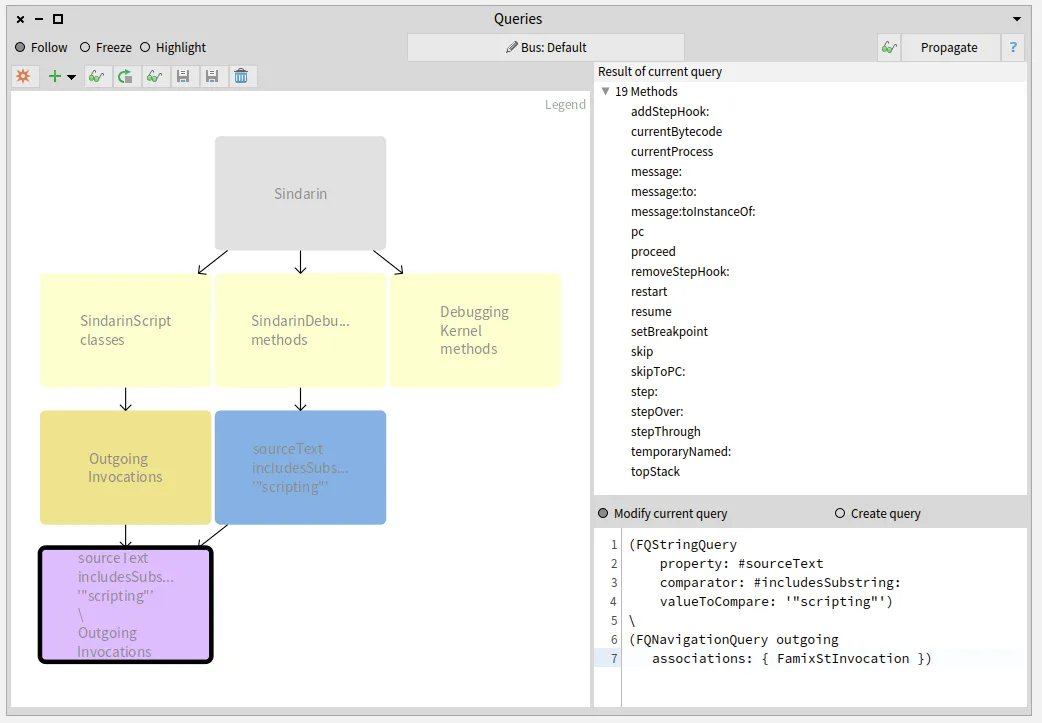
It was important for the debugging team to know the other 19 scripting API methods that are not called from the scripts.
We obtained them by querying the difference between Sindarin methods and the group of candidates (purple query at the bottom left in the figure below):
Again the 19 resulting methods are listed in the “Result” pane.
The debugging team now knows which methods from their scripting API have been useful for users and, most importantly, which methods have not.
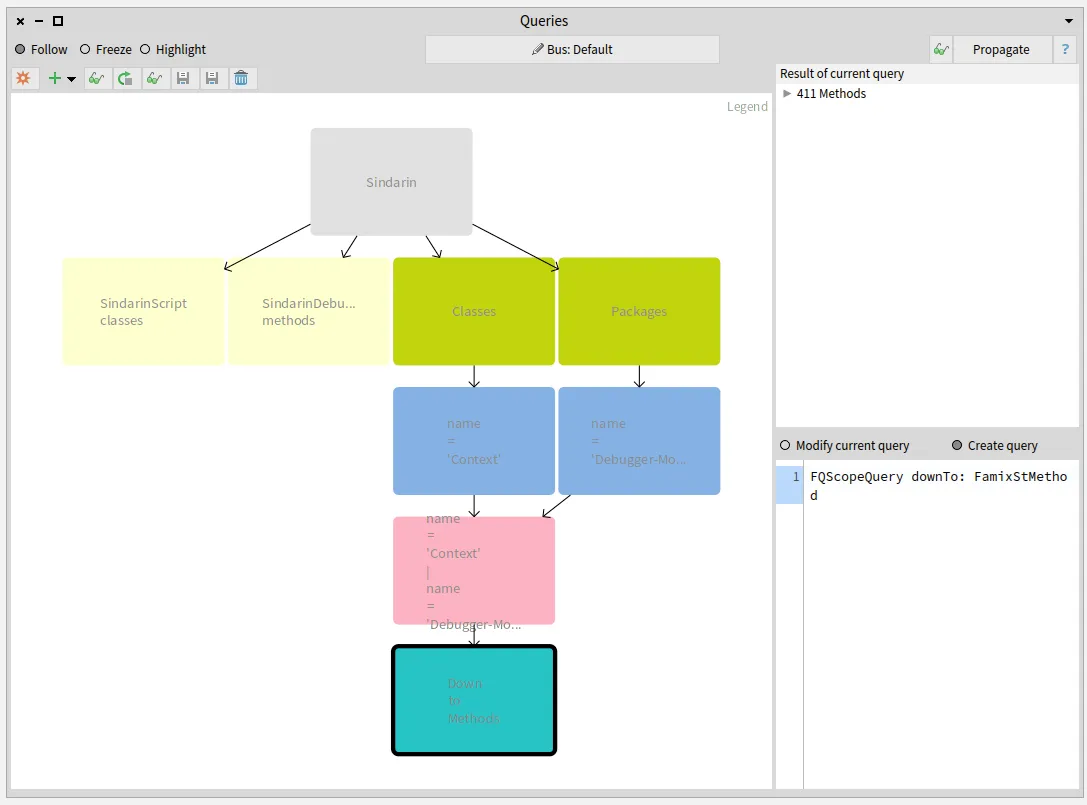
We also compared the group of candidates invoked from the users scripts with the methods of the debugging kernel and obtained 15 methods. These methods are used directly in the users scripts without using Sindarin:
Identifying the scripts that use the debugging kernel:
Let’s get back to the fact that outgoing invocations gave us a group of candidates methods.
When several methods share the same signature, we cannot know for certain which method is called.
For example: Sindarin defines #arguments, which is also defined in Context.
Sindarin defines:
arguments
^self context arguments
that should be used as follows:
sindarin := SindarinDebugger new.
"some steps"
(sindarin arguments at: 1) doSomething.
We wanted to detect cases where the users did not use Sindarin, like in the following:
sindarin := SindarinDebugger new.
"some steps"
(sindarin context arguments at: 1) doSomething.
This is a simple example or wrong practice.
In more complex cases, interacting directly with the kernel would force the user to write verbose scripts and increase the risk of bugs. Why not benefit from a tested API when you can ?
To detect these cases, we used a convention of the users scripts: each time a call to Sindarin API is made, the receiver is a variable named sindarin.
This means that invocations which receiver is not sindarin are probably cases where the user bypassed Sindarin API, calling the debugging kernel directly.
We inspected the 15 debugging kernel methods that may be used directly in the scripts and selected the ones that are sent from the scripts to a receiver other than sindarin.
This was done in Pharo (not the Query browser), using MooseQuery:
(invocation sender parentType name beginsWith: 'SindarinScript')
and: [ invocation receiver isNil
or: [ invocation receiver name ~='sindarin' ] ] ] ]
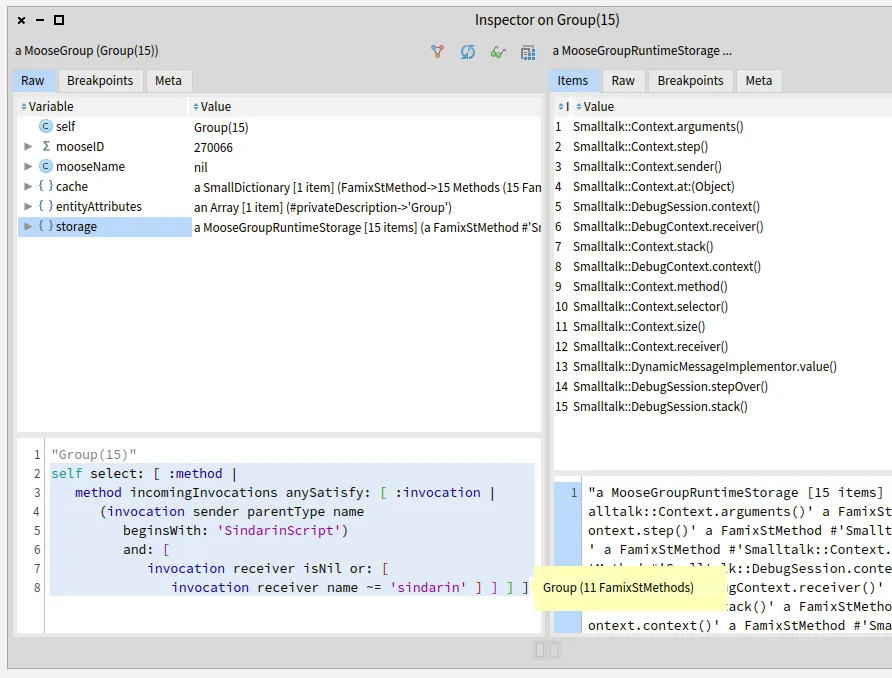
We narrowed it down to 11 methods of the debugging kernel that are called from the scripts:
We then collected the scripts where these methods are called:
self flatCollectAsSet: [ :method|
method incomingInvocations
select: [ :invocation|
(invocation sender parentType name beginsWith: 'SindarinScript')
and: [ invocation receiver isNil
or: [ invocation receiver name ~='sindarin' ] ] ]
thenCollect: #sender ]
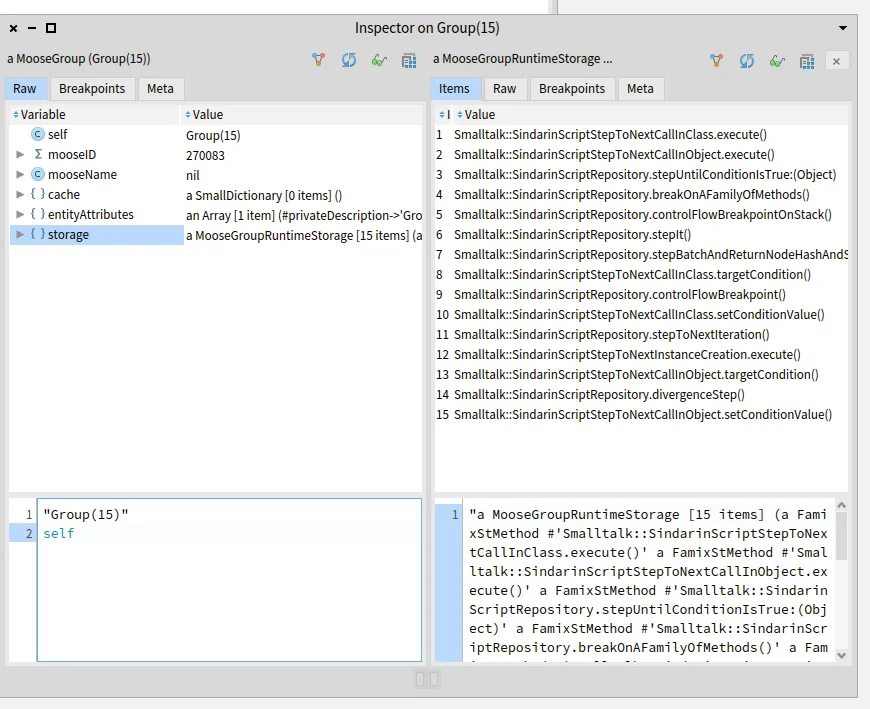
We obtain 15 user script methods that need to be investigated manually. Moose cannot determine which object will receive a message when the script is executed. The debugging team will analyze in the scripts the statements where the probable kernel methods are invoked. They will run the debugging scripts to identify at runtime which objects are the receivers.
Exploring these 15 scripts will help the debugging team to understand whether:
Users did not use Sindarin correctly: they interacted directly with the debugging Kernel, even though Sindarin methods are available,
Sindarin API is incomplete: users had no choice but to interact with the debugging kernel because Sindarin does not provide the necessary methods,
There are other reasons why the API is not used correctly?
With this experiment, we were able to provide valuable information to the debugging team.
In return, we got suggestions of improvements to be implemented in modular Moose tools.
To know how many times a method is called, we need the number of invocations of this method.
That is querying the size of a query result.
The query browser does not allow it yet, and it should.
To get the 15 users scripts that need to be explored, we had to inspect a group of methods and run a selection manually (Pharo code).
This should be possible directly in the queries browser: users should be able to build a query that executes a query script.
This experiment will help Pharo debugging team to improve Sindarin.
They will be able to make it more complete and documented, so users continue to develop debugging scripts.
In the meantime, we will improve modular Moose to widen the queries possibilities.
Then, we will challenge these new features: we will use them to analyze the upgraded Sindarin API to document its evolution.


 .
.